




Quick Summary: Employee Misclassification Statistics
- No government or private dataset counts misclassified workers directly, which is why the headline prevalence estimate spans a range as wide as 10% to 30% of employers.
- A misclassified worker in a high-risk occupation loses between $6,294 and $23,266 a year in pay and benefits, with the largest losses falling on truck drivers and construction workers.
- US federal back wage recovery reached $259 million in FY2025, the highest since 2019, even though the Wage and Hour Division closed fewer compliance actions than in 2024.
- The federal test for contractor status is mid-rewrite, with a proposed rule published 26 February 2026 and the comment period closed on 28 April 2026.
- EU member states must put a rebuttable presumption of employment for platform work into national law by 2 December 2026, shifting the burden of proof onto the platform.
How widespread employee misclassification is
Misclassification has no direct national count anywhere in the world. Every prevalence figure in circulation is modelled from state audits, tax records, or household surveys, which is why the credible estimates sit in ranges rather than points. The four figures below are the most defensible starting numbers available in 2026.
–30%
Between 10% and 30% of employers misclassify at least one worker
The estimate comes from a National Employment Law Project review of state-level misclassification reports, cited again in the Economic Policy Institute’s April 2026 analysis.
The width of the range reflects measurement method, not disagreement about whether the problem is real.
11.9 million Americans work as independent contractors
The Bureau of Labor Statistics counted them on their sole or main job in July 2023, equal to 7.4% of total employment.
The survey does not ask whether the classification is correct, so this is the pool misclassification is drawn from rather than a measure of it.
The contractor share of US employment has barely moved in 20 years
Independent contractors were 7.4% of employment in 2023, identical to the 2005 share and up from 6.9% in 2017.
The survey has run periodically since 1995 and the share has stayed inside a narrow band throughout.
No country publishes a direct count of misclassified workers
EPI states that no comprehensive private or public data source on workers misclassified as independent contractors exists.
Its own 2026 figures are modelled from BLS compensation and wage data instead. Any precise national total you see is an estimate with a method behind it.
What misclassification costs workers
The Economic Policy Institute modelled 11 occupations where misclassification is most common, using BLS compensation and wage data from 2025. The losses are large, they vary sharply by occupation and state, and they hold even under the generous assumption that employers raise base pay to offset missing benefits.
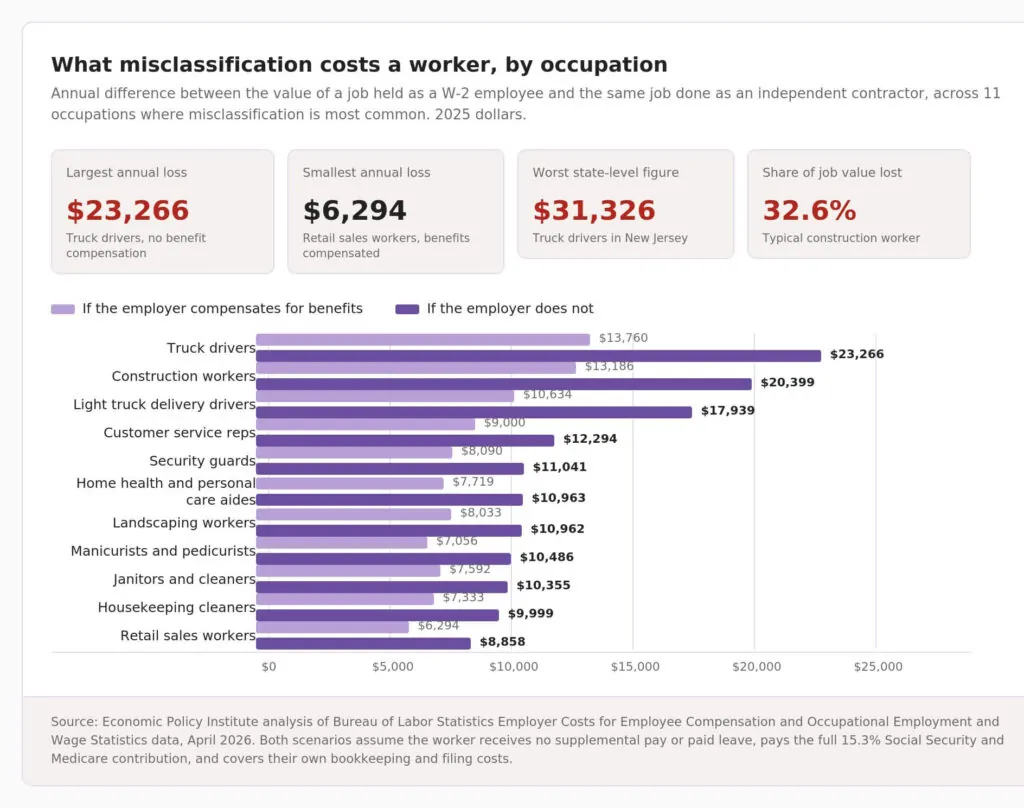
A misclassified truck driver loses up to $23,266 a year
Losses across the 11 modelled occupations run from $8,858 for retail sales workers to $23,266 for truck drivers, in 2025 dollars.
State figures go higher. Truck drivers misclassified in New Jersey lose an estimated $31,326 a year.
–$20,399
The cost to a construction worker turns on one assumption
EPI models two scenarios: employers either raise contractor pay to cover the health and retirement benefits an employee would receive, or they do not.
Even the generous scenario leaves the worker more than $13,000 a year worse off.
The same construction job is worth 32.6% less as a contractor
A typical construction worker earned $58,360 in median W-2 wages in 2025. Counting supplemental pay, paid leave, and employer benefit contributions, the job is worth $62,567.
Reclassified as a contractor with no benefit compensation, the same work is worth $42,169.
Misclassified workers pay the full 15.3% payroll tax themselves
Employees split Social Security and Medicare with their employer, paying 7.65% each. A worker labelled a contractor pays both halves.
EPI adds roughly $880 a year in bookkeeping, tax filing, and paperwork costs, equal to about 1.8% of pay.
What misclassification costs social insurance and public revenue
When a worker is reclassified as a contractor, unemployment insurance and workers’ compensation receive nothing at all, and Social Security and Medicare receive less because contractor pay is usually lower. The result is a measurable hole in the funds that pay out when workers are laid off or injured.
Social insurance loses up to 30% of revenue per misclassified worker
Contractors pay nothing into unemployment insurance or workers’ compensation, and lower contractor pay reduces Social Security and Medicare receipts.
The loss runs from 21% for manicurists to 29% for construction workers where employers do not raise pay to offset missing benefits.
Per-worker losses to social insurance range from $654 to $4,008
The ceiling is construction workers in Hawaii. The floor is housekeeping cleaners in Mississippi, at $654 a year.
Higher-wage states lose more per worker because contributions are calculated as a share of earnings.
One state found 12,300 misclassified workers by auditing 1% of businesses
New Jersey audits covering a single percent of employers uncovered more than $460 million in underreported gross wages and $14 million in lost state contributions.
The department restated these figures in July 2025 to make the point that the true cost is substantially higher.
Where misclassification concentrates by industry
Misclassification is not spread evenly across the economy. It clusters in labour-heavy sectors where margins are thin, subcontracting chains are long, and payroll costs are the largest line an employer can cut. Construction is the most studied case, and the measured rates there are far above the national employer average.
More than one in four residential construction employers misclassify workers
Massachusetts unemployment agency payroll audits found misclassification at 26.6% of residential building construction employers, affecting 16.6% of all workers in that subsector.
Rates fall sharply among plumbing and electrical contractors, where just 2.0% of employees were affected.
–2.1M
Up to 2.1 million construction workers are misclassified or paid off the books
The upper end represents roughly 19% of the entire US construction workforce.
The estimate combines misclassification with cash payment outside payroll, because state audits routinely find the two practices together.
Food services logged more violations, healthcare cost more in back wages
The Wage and Hour Division calls these low wage, high violation industries, and they were over-represented in its FY2025 caseload.
Healthcare produced 42% fewer resolved violations than food services but a larger back wage bill.
Misclassifying a construction worker removes 25.5% of pay in employer costs
Total compensation for a construction employee runs to 125.5% of pay once insurance, retirement, and legally required contributions are added.
Labelling the same worker a contractor removes that entire margin, which is the commercial reason misclassification concentrates in bid-driven industries.
US enforcement and penalties
Federal enforcement recovered more money in FY2025 than in any year since 2019, and it did so while closing fewer cases. Alongside that, state labour departments and private class actions have become the larger financial threat, with several seven and eight figure outcomes landing in 2026 alone.
Federal back wage recovery hit a five-year high in 2025
The Wage and Hour Division recovered more than $259 million for 176,957 workers in fiscal year 2025, an average of $1,465 each.
That is the highest total since 2019, though still below the $322 million record set that year.
The Wage and Hour Division recovered more from fewer cases
FLSA recovery rose from just under $150 million in FY2024 to over $184 million in FY2025.
Concluded compliance actions moved the other way, falling from 17,300 to just under 17,000 over the same period.
State agencies are assessing seven and eight figure penalties
New Jersey’s $100 million recovery from Uber and Rasier remains the largest payment of its kind by a wide margin.
The 2026 cases are smaller but arrive steadily, and they reach industries well outside the gig economy.
| Company | Country | Issue | Penalty | Year |
|---|---|---|---|---|
| Uber and Rasier | US (New Jersey) | Unpaid unemployment contributions, 297,866 drivers | $100 million | 2022 |
| Amazing Care Home Healthcare | US (Pennsylvania) | Nurses and home health aides classified as contractors | $12 million sought | 2026 |
| Care Specialist HCS | US (California) | In-home caregivers classified as contractors | $10 million | 2025 |
| PDX North | US (New Jersey) | 1,000 last-mile delivery drivers | $7 million | 2026 |
| WorkWhile | US (California) | Delivery drivers engaged through a gig staffing platform | $4.5 million | 2026 |
| STG Logistics | US (New Jersey) | Truck drivers classified as contractors | $2.775 million | 2026 |
Federal penalties run per violation, and back wages double
Repeated or willful minimum wage and overtime violations carry a civil money penalty of up to $2,515 each in 2026, normally assessed per worker.
Separately, the FLSA adds liquidated damages equal to the unpaid wages, and workers can reach back two years, or three if the violation was willful.
One state assessed $37 million in back wages in a single year
New Jersey assessed that sum for nearly 8,500 workers in 2025, against $19 million the previous year.
Its misclassification penalty, paid directly to workers rather than the state, has assessed close to $11 million for roughly 13,000 workers since 2021.
The shifting US legal standard
The federal test for contractor status has been rewritten twice since 2021 and is mid-rewrite again. That instability matters commercially, because the same worker can pass one agency’s test and fail another’s, and state law is often stricter than whatever Washington settles on.
The federal contractor test has changed three times since 2021
The Department of Labor proposed rescinding the 2024 six-factor rule on 26 February 2026 and returning to a narrower test built around control and opportunity for profit or loss.
Until a final rule lands, the 2024 rule remains the operative standard.
18 states and DC use the ABC test for some laws
The ABC test presumes employment and puts the burden on the employer to prove otherwise, which makes it the strictest standard in use.
Most of those states apply it only to unemployment insurance eligibility, and the number of ABC states has fallen over the past decade.
At least 12 states moved on misclassification in 2025 and 2026
Delaware made contractors liable when subcontractors misclassify. Colorado created penalties for willful misclassification. Minnesota ordered a study of the cost to workers and state revenue.
Traffic runs both ways. Bills in several states proposed narrowing existing ABC tests or carving out specific occupations.
Europe: the Platform Work Directive and national enforcement
Europe has done something the US has not, which is legislate a presumption of employment and put the burden of disproving it on the company. The directive takes effect across all 27 member states in December 2026, and the five countries that already run their own presumption regimes show how differently that can be enforced in practice.
93% of EU platform workers are formally self-employed
Of 28.3 million people working through digital labour platforms in the EU, 26.3 million are self-employed and only 2 million are employed.
That workforce is comparable in size to EU manufacturing, which employs around 29 million people.
–5.5M
Up to 5.5 million EU platform workers may be misclassified
The European Commission identified 5.5 million people working under a degree of platform direction and control, and judged that most are likely misclassified.
Court rulings across several member states have confirmed the pattern rather than the estimate.
Every member state must transpose the directive by December 2026
Directive 2024/2831 requires each country to establish a rebuttable presumption of employment where facts show direction and control.
The presumption does not apply retroactively. For contracts already running, it bites only from 2 December 2026 onward.
One platform’s Spanish exposure has grown fourfold since the fines began
Spain’s Labour Inspectorate fined Glovo €205.3 million over 37,348 riders treated as self-employed, then Social Security demanded a further €450 million in July 2025.
Delivery Hero has put the total contingency between €520 million and €860 million. Glovo hired 14,000 riders as employees by June 2025.
Enforcement strength varies sharply across existing presumption regimes
Spain and Belgium let labour authorities order reclassification administratively. Portugal must refer cases to a prosecutor and wait for a court ruling.
The Netherlands has a presumption but no public enforcement at all, so workers have to go to court themselves.
UK off-payroll working and IR35
The UK took the opposite route to the EU. Rather than presume employment, it made the engaging business responsible for deciding status and liable for getting it wrong. The results give the clearest available evidence of how badly self-assessed classification performs.
HMRC estimated just 10% of firms applied the original rules correctly
Under the original IR35 rules, contractors assessed their own employment status. HMRC judged that only one in ten of those who should have applied the rules did so properly.
Responsibility moved to the engaging organisation in 2017 for the public sector and 2021 for medium and large private firms.
Shifting the classification decision raised £4.2 billion in tax
HMRC attributes the additional revenue between October 2019 and March 2023 to the reform that moved status decisions onto the engaging business.
Around 120,000 workers were directly affected, roughly 1% of the UK workforce, concentrated in professional services and IT.
UK agencies and clients now share liability for umbrella PAYE
Where an umbrella company fails to account for PAYE, National Insurance, or the Apprenticeship Levy, HMRC can pursue the agency closest to the end client, or the end client itself if there is no agency.
Outsourcing the payroll no longer outsources the liability.
The Netherlands and the return of enforcement
The Dutch case matters because it shows what happens when a country stops enforcing and then starts again. The tax authority spent years declining to act on false self-employment, lifted that moratorium in January 2025, and has been restoring its penalty powers in stages since.
The Netherlands restarted false self-employment enforcement in 2025
The Dutch Tax Administration can now impose correction obligations and payroll tax assessments where it finds schijnzelfstandigheid.
Assessments cannot reach back past 1 January 2025 unless the employer acted deliberately or ignored instructions.
Twenty hours a month can trigger a presumption of employment
The Dutch Civil Code presumes an employment relationship for anyone doing paid work for the same party weekly across three consecutive months, or for at least 20 hours in a month.
It applies to all workers, not just platform workers, but no public authority enforces it. The worker has to go to court.

Conclusion
Misclassification is measured indirectly everywhere, yet every method tried finds it at scale, concentrated in the same labour-heavy industries and costing individual workers five figures a year. Enforcement is not softening even where the legal test is loosening, with US federal recovery hitting a five-year high in 2025 while the classification rule itself was being rewritten.
Europe is moving the other way entirely and will reverse the burden of proof across 27 countries in December 2026. What has changed most is where liability sits, shifting from the worker to the engaging business in the UK, and from the umbrella company to the agency and end client from April 2026.
For anyone running cross-border contractor arrangements, the practical implication is that contract wording carries almost no weight and the day-to-day facts of the relationship are what get tested.
